


Demand generation metrics like MQL-to-SQL, opportunity rate, stage velocity, and account signals forecast pipeline better than clicks.
Across 400+ campaigns, the numbers that predicted pipeline were not opens, clicks, or raw lead volume. The demand generation metrics that keep showing up before pipeline are MQL-to-SQL conversion, opportunity creation rate, stage velocity, and account-level behavior across multiple touches.
If your dashboard still leads with traffic, CTR, and form fills, you are watching interest, not revenue. That gap is why teams can feel busy for eight weeks and still miss pipeline.
Which demand generation metrics actually predict pipeline?
The short answer is simple. Metrics tied to qualification and downstream conversion predict pipeline better than activity metrics. Salesforce, Google, Gartner, and day-to-day outbound data all point the same way.
Salesforce puts shared success metrics on MQL-to-SQL conversion, marketing-influenced revenue, and total sales-cycle length. Google’s B2B research points to contact scoring, pipeline analytics, and off-site behavior. Gartner’s angle is blunt: sales teams care about lead quality, while marketing teams often get pushed toward lead volume.
That is the split you need to fix in your reporting.
[markdown] | Source | Year | Pipeline-linked metrics or findings | What it means for your dashboard | | --- | ---: | --- | --- | | Salesforce | Not stated | MQL-to-SQL conversion, marketing-influenced revenue, total sales-cycle length | Put conversion and revenue next to lead volume | | Salesforce Help | Not stated | Lifecycle reporting from prospect to MQL to SQL to won, plus average days in each stage | Track stage velocity, not just stage counts | | Think with Google | 2012 | Contact scoring, pipeline analytics, off-site and social behavior, touchpoint sequence | Use multi-touch and account-level behavior | | Gartner | 2024 | Lead-scoring benchmarks and objective lead-quality measurement | Quantity targets alone create weak pipeline | | Reachly | 2026 | Positive reply rate, meetings booked, pipeline value generated | Channel health matters, but only when it connects to qualified demand | [/markdown]A useful demand generation scorecard usually includes four buckets:
- qualification
- conversion
- velocity
- account engagement
If a metric does not sit in one of those buckets, it probably belongs lower on the page.
Why do traffic and engagement metrics miss pipeline risk?
Traffic tells you something got seen. It does not tell you whether the right accounts moved closer to a deal.
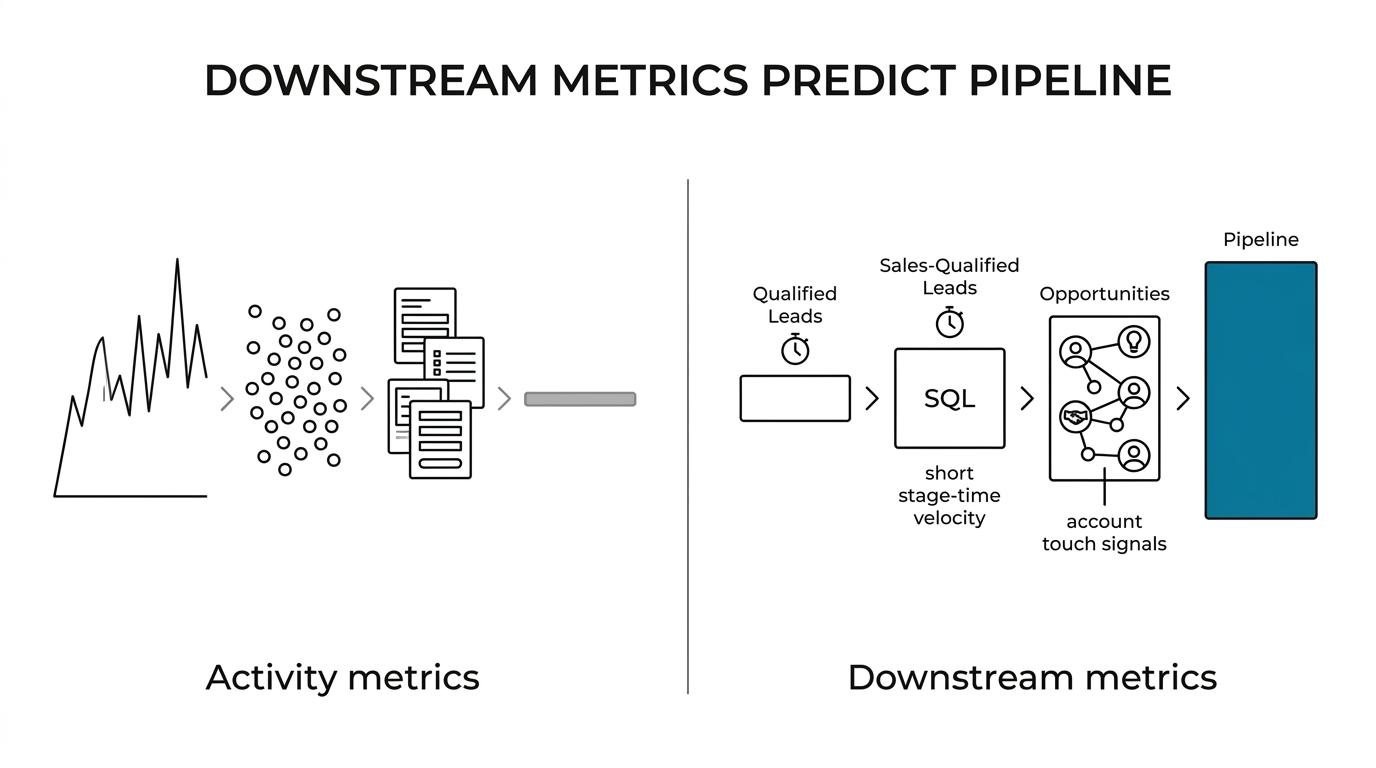
A paid campaign can double form fills and still produce worse pipeline if lead quality drops. A webinar can get 500 registrations and produce almost nothing if none of the attendees match the buying committee. An outbound sequence can show good open rates while reply quality collapses.
Single-contact activity also breaks down in B2B because buying decisions rarely sit with one person. You need multiple signals across the same account, over time, before pipeline starts to look real.
That is why account-level behavior matters more than isolated clicks.
- email opens
- ad impressions
- page views
- webinar signups
Those numbers still have a place. They are useful as early activity checks, not as pipeline forecasts.
How should you group demand generation metrics by funnel stage?
Most reporting gets noisy because the same metric gets used for two jobs. MQL volume gets treated as both a campaign output and a pipeline predictor. It is only the first one.
A cleaner model is to track one core metric per stage, then pair it with one question. That forces you to diagnose the right problem when the number moves.
[markdown] | Funnel stage | Core demand generation metric | Why it predicts pipeline | Question to ask when it drops | | --- | --- | --- | --- | | Lead or inquiry | Lead-to-MQL conversion | Shows whether the message attracts fit, not just curiosity | Are you pulling in the right accounts? | | MQL | MQL-to-SQL conversion | Shows whether sales accepts the lead as real demand | Did scoring or qualification get looser? | | SQL | SQL-to-opportunity rate | Shows whether demand survives a live sales conversation | Is the handoff weak, or is the pain too small? | | Opportunity | Opportunity value created | Shows whether qualified demand turns into real pipeline | Are you attracting buyers with budget and timing? | | Full lifecycle | Total sales-cycle length | Shows whether pipeline is moving or stalling | Which stage is holding deals too long? | | Account engagement | Engaged accounts and multi-contact activity | Shows whether buying groups are waking up | Are you reaching one person or the whole account? | [/markdown]Salesforce’s lifecycle reporting is useful here because it measures average time between stages, not just stage totals. That matters because slow movement is often the first visible sign of pipeline trouble.
A stage can look full and still be weak if deals sit there too long.
Which account-level demand generation signals matter before opportunity creation?
If you want earlier warning signs, stop treating every lead as a separate story. Start tracking the account.
At Reachly, signal-based targeting matters because accounts buy, not individuals. A company hiring five reps, replacing a core tool, and showing website intent is a very different prospect from a single contact who clicked one ad.
The signal stack usually falls into four groups:
- Company-level signals: funding, hiring, leadership change, tech stack change, headcount growth, M and A
- Website and behavioral signals: visitor ID, traffic decline, ranking gaps, repeat visits to commercial pages
- LinkedIn signals: engagement, job changes, profile views, connection acceptance, replies
- Intent scoring: multiple fresh signals on one account, weighted into a single priority score
Freshness matters as much as the signal itself. Buying intent has a shelf life, and it is short. In outbound, we usually treat 2 to 4 weeks as the useful window before competitors catch up.
The other piece is signal combination. Reachly has seen that two signals firing on the same account in the same window convert at roughly three times the rate of either signal alone. That is why a single form fill should not outweigh hiring plus website intent plus LinkedIn engagement.
This is the operating logic behind Reachly’s outbound lead generation services. The point is not more touches. The point is better timing.
What benchmarks actually matter when you are forecasting pipeline?
There is no universal MQL-to-SQL benchmark worth copying across every market. Your ACV, sales motion, category, and buying committee shape the number too much.
What you do need is a split between channel health metrics and pipeline prediction metrics. The first group tells you whether execution is clean. The second tells you whether revenue is likely to show up.
For outbound, channel health looks more like this:
- Bounce rate: under 3%
- Deliverability score: above 97%
- LinkedIn connection acceptance: 25% is a solid benchmark
- Positive reply rate: 10 to 20% is normal, 35 to 40% is very good
Those numbers matter, but only as leading indicators. A mailbox with bad deliverability will kill pipeline later. A campaign with great deliverability and weak conversion has a different problem.
Thibault Garcia, founder of Reachly, puts it plainly: “When a campaign has a healthy reply rate and still no positives after a thousand emails, the copy is doing its job and the offer is the thing that needs rewriting.”
That same logic applies to demand generation as a whole. If traffic is healthy, lead volume is healthy, and MQL-to-SQL falls apart, the top of funnel is not the issue. Your offer, scoring model, or handoff probably is.
You can see that in Reachly’s own results. Primal generated 85+ SQLs in 6 months, signed 6 deals, reduced CAC by 35%, and hit 4.57x ROI. The useful proof is not that emails were sent. The useful proof is that qualified demand moved into SQLs, deals, and payback. The same pattern shows up in The Great Room, where face-to-face meetings went from 2 per quarter to 2 per month and a $250K contract followed, with no added headcount.
When do demand generation metrics stop being useful?
Metrics stop helping when they hide bad economics or a weak sales motion.
A rising MQL count is not good news if your average contract value is too low to support the motion. Strong account engagement is not good news if sales rejects the lead definition. Fast opportunity creation is not good news if win rates collapse.
This is where teams fool themselves with reporting.
- ACV under $5,000
- no proof of product-market fit
- tiny TAM with heavy automation
- no shared definition of SQL
If one of those is true, you do not have a measurement problem first. You have a go-to-market problem first.
That is also why sales and marketing should share fewer metrics, not more. Shared metrics work only when both teams can act on them. MQL-to-SQL, opportunity rate, and sales-cycle length are shared. Email click rate usually is not.
What should you track next if pipeline is the goal?
Start with eight metrics or fewer. If you need twenty charts to explain demand health, the scorecard is already too crowded.
A practical scorecard for most B2B teams looks like this: lead-to-MQL conversion, MQL-to-SQL conversion, SQL-to-opportunity rate, opportunity value created, total sales-cycle length, engaged accounts, buying-signal coverage, and revenue influenced by source. That gives you qualification, conversion, velocity, and account behavior in one view.
If your outbound motion runs across cold email, LinkedIn, cold calling, keep the execution metrics on a second tab. They matter. They just should not headline the forecast.
If you want a second set of eyes on that scorecard, book the meeting with Reachly. We build signal-based outbound systems, handle reply management and B2B appointment setting, and report on the numbers that connect activity to qualified meetings and pipeline. You can also see how the system works in our outbound tools breakdown.
The short version is this: pipeline prediction gets better when you move past top-of-funnel activity and track qualification, conversion, velocity, and account-level behavior. The less your dashboard depends on vanity metrics, the faster you can spot whether the issue is targeting, offer, handoff, or sales follow-up.
Key findings recap:
- Track downstream conversion: MQL-to-SQL, SQL-to-opportunity, and revenue beat raw lead volume
- Watch velocity: stage-by-stage time shows pipeline risk earlier than stage totals
- Use account-level behavior: multiple fresh signals on one account tell you more than single-contact clicks
- Separate health from prediction: bounce rate and deliverability matter, but they are not pipeline by themselves