

Pipeline coverage ratio depends on win rate, not the 3x rule. Learn how to calculate real coverage and count only qualified pipeline.
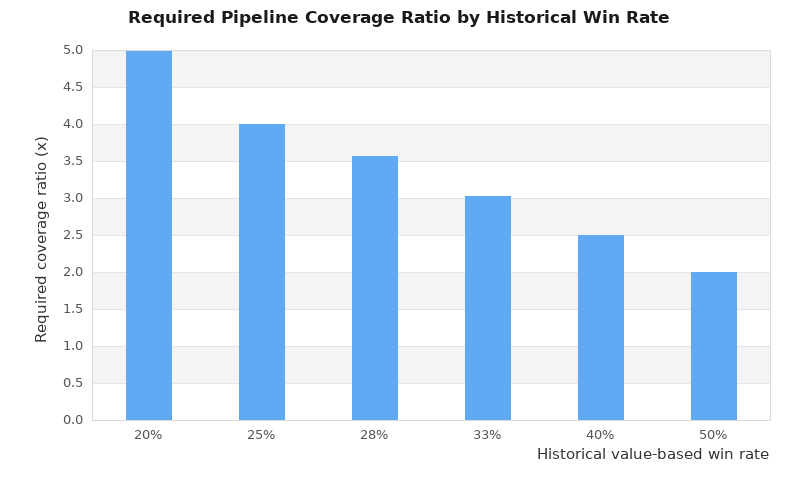
A pipeline coverage ratio of 3x means you have three times your revenue target sitting in qualified pipeline. That is the basic metric. The number you actually need depends on your historical win rate, not a slogan. If your value-based win rate is 25%, you need 4x coverage. If it is 40%, you need 2.5x.
What is pipeline coverage ratio and why do teams misread it?
Pipeline coverage ratio is the dollar value of open opportunities divided by the revenue target for the period. If the quarter target is $1 million and your open, qualified pipeline is $3 million, your coverage is 3x.
The mistake is simple. Teams count everything with a close date, then act surprised when the quarter misses. A pipeline can look healthy on paper and still be weak if the deals are unqualified, slipping, or never had a real chance to close in that period.
Published benchmarks support the rough 3x to 4x range, but they also point back to win rate. That is the part people skip.
[markdown] | Source | Year | What it says | What to do with it | | --- | ---: | --- | --- | | Rox | 2026 | Required qualified pipeline = revenue target ÷ historical value-based win rate | Use your actual win rate to size coverage | | Salesforce Magazine | 2023 | Open pipeline is commonly 3x to 4x the current goal | Treat 3x to 4x as a shortcut, not the formula | | OpenView Partners | 2013 | Coverage target should be the inverse of opportunity win rate | If your win rate drops, required coverage rises fast | [/markdown]A good pipeline coverage ratio only counts opportunities that are eligible to close inside the period. If the deal will not close this quarter, it does not belong in this quarter’s coverage math.
How do you calculate pipeline coverage ratio from win rate?
The clean formula is short.
Required qualified pipeline = revenue target ÷ historical value-based win rate
You can also express it as a ratio.
Required coverage ratio = 1 ÷ historical value-based win rate
Rox uses a clear example. A $4 million target with a 28% historical value-based win rate needs about $14.29 million in qualified pipeline. That works out to 3.57x coverage.
That formula matters because it forces you to use closed-won history, not stage fantasy. If you close 1 in 4 dollars of real pipeline, you need 4 dollars of pipeline for every 1 dollar of target. No amount of dashboard polish changes that.
[markdown] | Historical win rate | Required coverage ratio | | ---: | ---: | | 20% | 5.00x | | 25% | 4.00x | | 28% | 3.57x | | 33% | 3.03x | | 40% | 2.50x | | 50% | 2.00x | [/markdown]Use value-based win rate if deal sizes vary a lot. Counting deals instead of dollars can hide a bad mix. Five tiny wins and one large loss still miss the number.
Why is 3x pipeline coverage only a rough rule?
A 3x target assumes a win rate around 33%. That is all it is. If your actual win rate is 18%, 3x coverage leaves you exposed. If your actual win rate is 45%, 3x means you are carrying more pipeline than you need.
The bigger issue is quality. A weak pipeline with 5x coverage is still weak. If half the opportunities are outside your ICP, missing a buying signal, or sitting with fake close dates, the ratio gives you false comfort.
You see the same pattern in outbound. Teams celebrate booked meetings, then learn too late that the wrong people took them. Reachly treats pipeline generation as sales-accepted opportunities, not raw lead volume, because booked activity does not pay the target.
After that shows up for a month or two, the same failure points repeat:
- Wrong denominator: coverage is compared against the target, but the pipeline includes deals that cannot close in time
- Weak qualification: opportunities enter pipeline before sales accepts them
- close dates pushed forward every month
- Stage inflation: deals move stages without a real buyer action
- raw meetings counted like real pipeline
What should count in pipeline coverage and what should stay out?
Count qualified opportunities with a real close path. That means a real buyer, a real problem, a next step, and a close date inside the period you are measuring. If sales would not put time into that deal this week, it should not sit in coverage.
This matters even more when you are feeding pipeline through outbound. In a healthy system, you want first meetings that match the ICP and turn into real opportunities. That is the standard behind Reachly’s outbound lead generation services, where the output is qualified meetings and booked pipeline, not list volume.
Keep the rules boring and strict.
- Include: sales-accepted opportunities eligible to close in the target period
- qualified meetings tracked separately from pipeline dollars
- slipped deals with a fresh buyer action and a realistic new close date
- Exclude: raw leads, early interest, and meetings with no fit
- Exclude: opportunities parked in the CRM to make the report look better
If you need a second check, ask one question. Would your sales lead stake the forecast on this deal right now? If the answer is no, it does not belong in coverage.
How do you turn a revenue target into meeting targets?
You only need four inputs to work backward from revenue to meetings: revenue target, average deal size, win rate, and the share of first meetings that become opportunities. That turns pipeline coverage from a finance metric into an operating plan.
The math runs in order.
[markdown] | Step | Formula | What it answers | | --- | --- | --- | | 1 | Revenue target ÷ average deal size | How many closed deals you need | | 2 | Deals needed ÷ win rate | How many opportunities you need | | 3 | Opportunities needed ÷ meeting-to-opportunity rate | How many qualified meetings you need | | 4 | Qualified meetings needed ÷ qualification rate | How many meetings you need booked | [/markdown]That last line is where teams get tripped up. They know the revenue target. They know the deal size. They usually know win rate. They do not know how many meetings are actually qualifying.
Reachly’s benchmark is clear here. When TAM mapping is done well, 80% to 90% of meetings qualify. That is the difference between activity and usable pipeline.
Example. For planning only, treat 10 to 40 outbound-generated leads a month as 10 to 40 booked meetings. If 80% to 90% of those meetings qualify, the range looks like this:
[markdown] | Monthly booked meetings | Qualified at 80% | Qualified at 90% | | ---: | ---: | ---: | | 10 | 8 | 9 | | 20 | 16 | 18 | | 30 | 24 | 27 | | 40 | 32 | 36 | [/markdown]That example is useful because it shows the constraint fast. If your math says you need 25 qualified meetings a month and your current engine produces 10 booked meetings, you do not have a reporting issue. You have a pipeline creation issue.
What should you do when pipeline coverage is too low?
Start with the math, then the funnel, then the acquisition engine. Do not rewrite the forecast before you fix the inputs.
First, check win rate against the last few quarters. If it dropped, required coverage went up. Second, check what is being counted as pipeline. If qualification got loose, the ratio is inflated. Third, check slippage. A large pipeline with repeated date pushes is not protection.
If the math is real and the pipeline is thin, you need more qualified opportunities fast. This is where outbound earns its place. Reachly runs signal-based campaigns across cold email, LinkedIn, and cold calling because you do not fill a coverage gap with random list volume. You fill it by finding buyers in an active window, then booking the meeting while the signal is fresh.
Thibault Garcia, founder of Reachly, puts it plainly: “The goal of a cold email is a reply, not a meeting. No reply, no meeting.” That matters for coverage because weak outreach creates fake top-of-funnel noise, not pipeline.
Outbound also gives you speed. A working program ships in 3 to 4 weeks and tells you fast whether the offer matches the market. If reply rate is healthy and positive replies never show up, the offer is the problem. A Series A client sending 20,000 to 30,000 emails a month moved reply rate from 0.5% to 1% up to 1.6% after switching to direct, question-based copy with a lead magnet and a stronger offer. The offer changed the outcome.
When does pipeline coverage ratio stop being useful?
It breaks when your inputs are fiction. If you do not have a stable win rate, the ratio is a guess. If your close dates are unreliable, the ratio is a guess. If your sales stages mean different things to different reps, the ratio is a guess.
This also applies to very small TAMs. If your market is tiny and specific, automation burns through the list faster than the market can absorb it. Founder-led outreach stays the better move there.
Garcia’s view is direct: “Outbound multiplies the sales process you already have. When there is no process, there is nothing to multiply.” The same is true for pipeline coverage. It multiplies the truth already sitting in your CRM. It does not create truth.
If your average contract value is under $5,000, or you are still guessing at product-market fit, treat coverage as a rough planning note. Do not treat it like a control panel.
What should you track alongside pipeline coverage ratio each month?
Pipeline coverage ratio is one number. It needs supporting numbers around it, or it lies by omission.
[markdown] | Metric | Why it matters | | --- | --- | | Value-based win rate | Sets the real coverage you need | | Qualified meeting rate | Shows whether top-of-funnel activity becomes usable pipeline | | Meeting-to-opportunity rate | Tells you if meetings are turning into real sales conversations | | Pipeline slippage rate | Exposes deals that keep getting pushed forward | | Opportunities eligible to close | Keeps dead weight out of the coverage math | [/markdown]If your coverage math says you need more pipeline, and your current team cannot produce it fast enough, that is when a done-for-you outbound system makes sense. Reachly builds signal-based outbound across cold email, LinkedIn, and cold calling, then handles targeting, reply management, and meeting booking. You can book the meeting through our outbound lead generation services page or see how the handoff works on our B2B appointment setting services page.
Short version: pipeline coverage ratio is simple math wrapped around messy pipeline reality. The right coverage number comes from your historical win rate, your qualification standard, and what can actually close in the period.
Key findings recap:
- Pipeline coverage ratio: qualified open pipeline divided by target revenue
- Required coverage ratio: 1 divided by historical value-based win rate
- 3x is a shortcut, not the formula
- unqualified or slipped deals make coverage look safer than it is
- meeting quality matters because weak meetings do not become pipeline