
Learn pipeline velocity with a real B2B example: formula, 85 SQLs to 6 deals, 7.1% win rate, and the inputs needed to measure revenue/day.
Pipeline velocity tells you how much revenue your pipeline creates per day: (qualified opportunities × average deal size × win rate) ÷ sales cycle length in days. On Reachly’s work with Primal, 85+ SQLs turned into 6 deals in 6 months, which gives you the volume and win-rate side of the formula right away. To finish the math, you still need two numbers many teams do not track cleanly: average deal size and average sales cycle length.
Most teams say they want more pipeline. What they usually need is faster, cleaner movement through the pipeline they already have. If volume rises but win rate drops, or cycle length stretches from 30 days to 90, the extra meetings do not help much.
What is pipeline velocity, exactly?
Pipeline velocity is a revenue movement metric, not a meeting count metric. It answers a simple question: how much revenue is moving through your sales pipeline each day?
That matters because two funnels can look identical at the top and still produce very different results. One closes quickly with strong deal quality. The other stalls in late stage, needs constant chasing, and closes only when discounting starts.
Salesforce publishes the standard formula below.
[markdown] | Source | Year | Formula | What it tells you | | --- | ---: | --- | --- | | Salesforce | Undated | (Number of deals in pipeline × average deal size × win rate) ÷ average sales cycle length in days | Revenue generated per day from pipeline movement | [/markdown]If you own pipeline, this formula does one useful thing fast. It stops you from hiding behind volume.
Which numbers go into the pipeline velocity formula?
There are four inputs, and each one can break the usefulness of the metric if you define it badly. “Pipeline” is the usual problem. If one team counts every demo booked and another counts only real opportunities, their velocity numbers are not comparable.
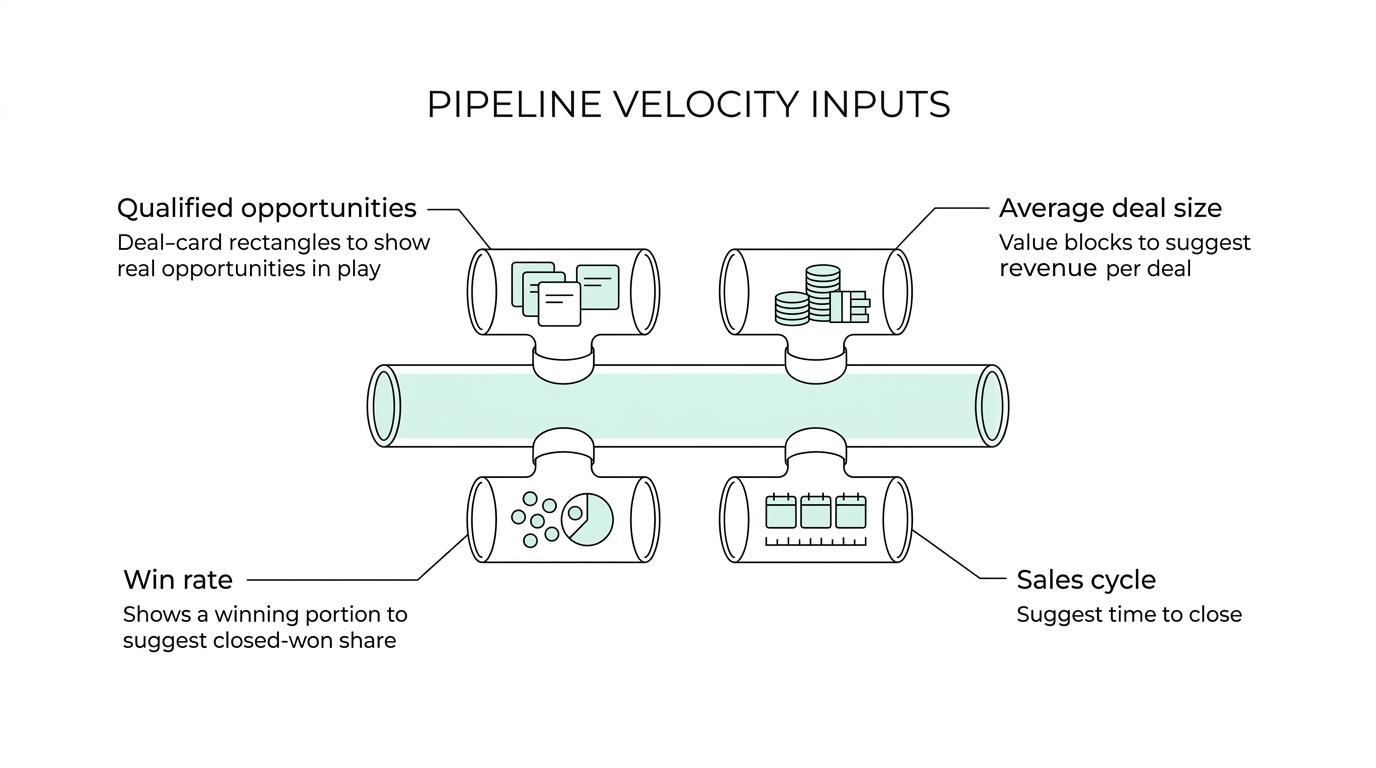
The clean version uses qualified opportunities only. In practice, that means sales-accepted opportunities with a real chance of closing, not raw leads and not positive replies.
- Qualified opportunities: the count of real deals in play
- Average deal size: expected revenue per closed deal
- Win rate: closed-won deals divided by qualified opportunities
- Sales cycle length: average number of days from opportunity creation to close
You also need to keep the time window consistent. If your win rate comes from the last 12 months but your deal size comes from the last 30 days, the output is noise.
How does the pipeline velocity formula look on a real B2B example?
The public numbers from Reachly’s Primal case study are useful because they show real funnel movement, not theory. Over 6 months, the program produced 85+ SQLs, 6 new deals, a 35% CAC reduction, and a 4.57x ROI. The campaign also averaged an 8% positive reply rate.
Here is what you can calculate from those numbers today.
[markdown] | Pipeline input | Public Primal data | What you can calculate | | --- | --- | --- | | Qualified opportunities | 85+ SQLs in 6 months | Top-of-pipeline opportunity volume | | Closed deals | 6 deals in 6 months | Outcome volume | | Win rate | 6 ÷ 85 = 7.1% | SQL-to-deal close rate | | Average deal size | Not public | Still needed for revenue velocity | | Sales cycle length | Not public | Still needed for daily velocity | [/markdown]That 7.1% number matters. It means roughly 1 in 14 SQLs became a deal. On a monthly basis, 85 SQLs over 6 months works out to about 14.2 SQLs per month. Apply the same 7.1% close rate and you get almost exactly 1 new deal per month at steady state.
That is not the full pipeline velocity output yet. It is the conversion spine behind it.
If you plug Primal’s public numbers into the standard formula, the calculation looks like this:
Pipeline velocity = (85 × average deal size × 7.1%) ÷ average sales cycle in days
You can simplify that to:
Pipeline velocity = (6.035 × average deal size) ÷ average sales cycle in days
So if average deal size and cycle length were known, the rest would be easy. The lesson is not “guess the missing numbers.” The lesson is that most teams already have half the formula and still do not use it.
What can you learn from 85 SQLs and 6 deals even without deal size?
A lot, if you stop treating pipeline velocity as one giant blended metric.
First, you can see whether your opportunity creation rate is high enough to support your revenue target. If you need 4 new deals a month and your system is producing 14 SQLs a month at a 7.1% close rate, the gap is obvious. You either need more qualified opportunities, a higher win rate, or both.
Second, you can separate top-of-funnel quality from closing ability. Primal’s 8% positive reply rate tells you the message and targeting were getting traction. The 35% CAC reduction tells you those conversations were cheaper to acquire than the previous mix. That does not prove every late-stage sales problem disappeared, but it does show the pipeline got more efficient.
A clean read usually comes down to three questions.
- Volume: are enough qualified opportunities entering the pipeline?
- Conversion: does that opportunity pool close at a healthy rate?
- Speed: how many days pass before revenue lands?
If you only track the first one, your team can feel busy while revenue stays flat.
Which mistakes make pipeline velocity useless?
The biggest mistake is using the wrong denominator. Teams say “sales cycle” and then mix calendar time, rep response time, legal time, and deals that were never real. That inflates cycle length and makes the pipeline look slower than it is.
The second mistake is counting weak pipeline as if it were real pipeline. A list of positive replies is not the same as qualified opportunities. Neither is a batch of meetings where the buyer has no budget, no urgency, and no reason to switch.
The third mistake is skipping offer quality. If your outbound gets replies but not real opportunities, the bottleneck is usually not the formula. It is the thing being offered.
Thibault Garcia, founder of Reachly, says it plainly: “When a campaign has a healthy reply rate and still no positives after a thousand emails, the copy is doing its job and the offer is the thing that needs rewriting.”
Watch for these failure modes:
- raw leads counted as pipeline
- win rate measured from the wrong stage
- stale average deal size
- sales cycle inflated by dead opportunities
- channel volume hiding a weak offer
A velocity metric built on bad stage definitions is still a bad metric.
How do you increase pipeline velocity without burning your list?
You have only four levers because the formula has only four inputs. More qualified opportunities. Bigger deal sizes. Better win rate. Shorter sales cycles.
Outbound can affect three of those quickly if you run it well. Signal-based targeting lifts opportunity quality. A better offer lifts win rate. Tighter targeting and cleaner problem framing shorten the path to a serious conversation.
This is why Reachly runs cold email, LinkedIn, cold calling together, with signal-based targeting built in Clay. The point is not channel count. The point is getting in front of buyers when a real reason to change exists. Hiring, headcount growth, tech stack changes, leadership moves, and website behavior all give you better timing than a static list ever will.
A few levers tend to move the number fastest:
- Targeting first: qualified opportunities rise when the list is built around real buying signals
- Offer second: win rate rises when the first ask is clear, low friction, and worth answering
- Sales speed third: cycle length falls when the problem is already active inside the account
One caution here. Long sequences do not fix weak velocity. They usually hide it for a few weeks. If the first message is off, or the offer is weak, sending five more touches just burns list quality and sender reputation.
When should you stop using pipeline velocity as the main metric?
Pipeline velocity is strong when you already have a working pipeline and need to understand its movement. It is weaker when you do not yet have consistent stage definitions, steady opportunity flow, or enough closed-won data to trust win rate.
That is common in early outbound. In the first weeks, reply rate, positive reply rate, and SQL creation tell you more than revenue velocity does. Reachly usually sees first qualified meetings in weeks 5 to 7, after warm-up and ramp. Before that point, trying to force a neat revenue-per-day number gives you false confidence.
You also should not lean on pipeline velocity if your market is tiny. If you sell into 50 dream accounts, the math gets lumpy. One deal can swing the number hard. In that case, account progression and close plan quality matter more than a blended formula.
What should you do if your pipeline velocity is flat?
Start with the part you can verify, not the part you hope is true. If volume is weak, fix targeting and list quality. If volume is fine but win rate is poor, rewrite the offer before you rewrite the whole sequence. If win rate is healthy but revenue still stalls, inspect cycle length by stage and see where deals wait.
That is the practical order:
- Low qualified opportunity volume: check TAM, ICP filters, signals, and deliverability
- Low win rate: check offer, buyer pain, and handoff quality from outbound to sales
- Long cycle length: check stage exits, follow-up speed, and decision-maker coverage
If you want a second set of eyes on the math, book the meeting with Reachly. The team builds signal-based outbound systems that give you cleaner pipeline inputs in the first place. If you want to test deal economics before changing anything, run the numbers through the ROI calculator.
Pipeline velocity is simple on paper and unforgiving in practice. The formula is easy. Getting clean inputs is the hard part.
Key findings recap:
- Formula: pipeline velocity = qualified opportunities × average deal size × win rate, divided by sales cycle length in days
- Primal example: 85+ SQLs and 6 deals in 6 months produce a 7.1% close rate and about 1 new deal per month at steady state
- Missing inputs: average deal size and cycle length are still required for full revenue-per-day velocity
- Main levers: better qualified opportunity volume, stronger win rate, shorter cycle length