 Key Findings
A good cold email benchmark in 2026 is defined by your targeting, infrastructure, and offer, not by a global industry average. Read your campaign against the strong column, not the average one.
Apple Mail Privacy Protection inflates opens and blocked pixels hide them, so the same campaign can read 60 percent or 15 percent. Use opens as a rough deliverability check, never as a success metric.
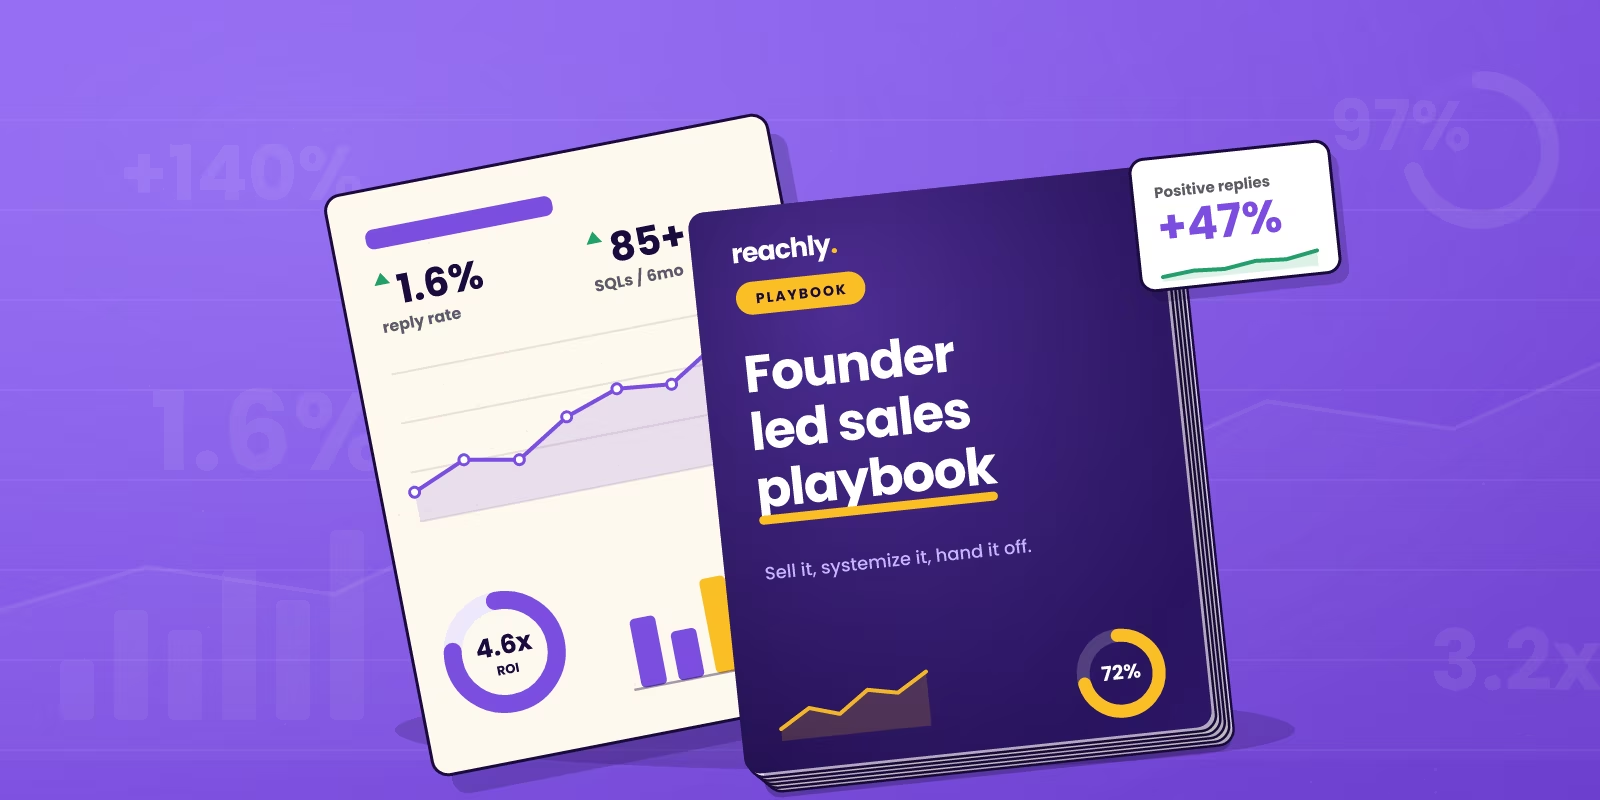
1 to 3 percent is normal, 8 percent is strong. Primal, a Reachly client, averaged 8 percent and turned it into 85+ SQLs and a 4.57x ROI. Targeting moves this number more than any subject line.
These gate every other metric. Validate lists older than 3 months, authenticate with SPF, DKIM, and DMARC, and warm up every mailbox for 30 days before real volume.
Infrastructure, then targeting, then offer, then copy, then sequence length. Most weak campaigns break at infrastructure or offer, not copy, so diagnosing in that order is what lifts the numbers.
Every founder quoting a cold email benchmark is quoting it out of context. Someone read that a 40 percent open rate is average, or that a good reply rate is 10 percent, and now that number is the yardstick a whole campaign gets judged against. The problem is that most published cold email benchmarks are averages across billions of emails from every industry, every list quality, and every level of targeting, which makes them close to useless for deciding whether your outbound is working.
This guide gives you real cold email benchmarks for 2026, split by what you can actually control, with poor, average, and strong ranges for every metric that matters: bounce rate, deliverability, open rate, reply rate, positive reply rate, and meetings booked. It also covers why open rate is the most misleading number on the list, and what separates a campaign that hits the strong column from one stuck at average.
The ranges here are the ones Reachly works to when running cold email for B2B clients. On our own campaigns we hold bounce rate under 2 percent and treat anything above 5 percent as a level that risks provider blocks. Where we cite a client result, it is a real one, so you can calibrate your own numbers against outbound that is actually booking meetings rather than against a blended industry average.
What counts as a good cold email benchmark in 2026
A benchmark is only useful if it accounts for the things that move it. Two campaigns can send the identical email and post wildly different numbers because one is targeting a tight, signal-based list and the other is blasting a scraped database. So before any number means anything, anchor on this: a good cold email benchmark in 2026 is defined relative to your targeting, your infrastructure, and your offer, not against a global average.
There is also a metric hierarchy that most benchmark posts get backwards. Open rate sits at the top of everyone's dashboard, but it is the least reliable and least important number in 2026. The metrics that predict pipeline are further down: positive reply rate and meetings booked. If you only track one cold email benchmark, track positive reply rate, because a reply from someone who wants to talk is the only signal that reliably converts into revenue. The rest are diagnostic. We lay out the full diagnostic order in our guide to cold email best practices for higher reply rates in 2026.
Cold email benchmarks 2026: the numbers
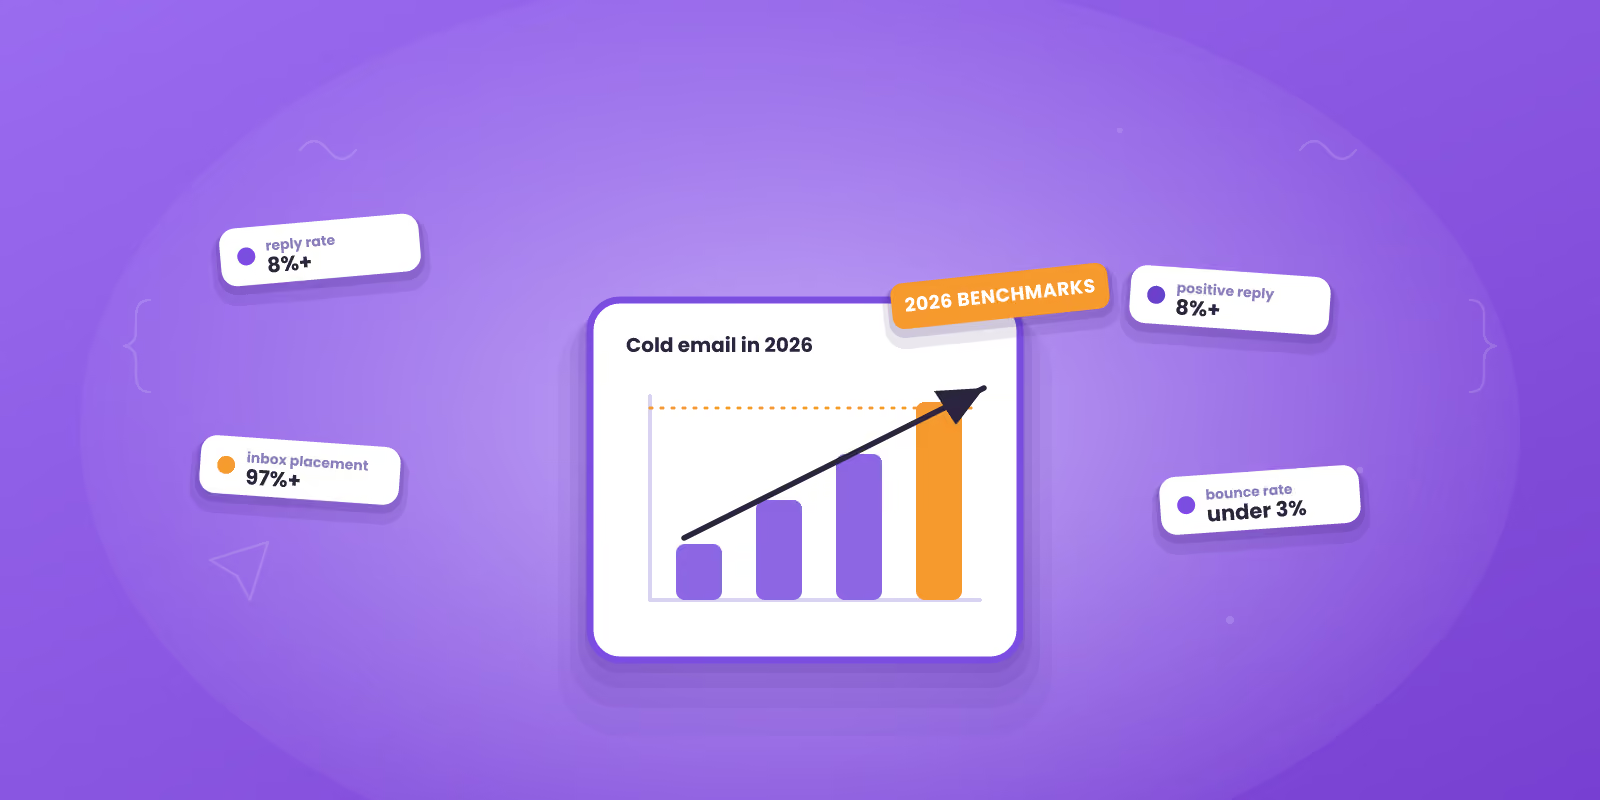
Here is the full table of cold email benchmarks for 2026, with a poor, average, and strong range for each metric. Read your own campaign against the strong column, not the average one. Average is what happens when the list, the infrastructure, and the offer are all fine but none of them are sharp. Strong is the target, and it is reachable on every metric with the right setup.
| Metric | Poor | Average | Strong (2026 target) |
|---|---|---|---|
| Bounce rate | Over 5% | 3 to 5% | Under 3% |
| Inbox placement | Under 85% | 90 to 95% | 97% and above |
| Open rate (unreliable) | Under 20% | 30 to 45% | 50% and above |
| Reply rate (all replies) | Under 1% | 1 to 5% | 8% and above |
| Positive reply rate | Under 1% | 1 to 3% | 8% and above |
| Meetings booked rate | Under 0.5% | 0.5 to 1% | 2% and above |
Two things to flag before you use this table. First, these are campaign-level numbers for genuinely cold outreach, not for warm or opted-in lists, which run far higher. Second, the ranges assume your authentication and warm up are already correct. If SPF, DKIM, and DMARC are not passing, or a mailbox skipped its warm up, every downstream number collapses and no copy change will fix it. Get the infrastructure right first, which is the whole point of our email deliverability guide.
Cold email open rate benchmarks and why they lie
The published cold email open rate benchmark usually lands somewhere between 30 and 50 percent, and you should treat that number with suspicion. Open tracking works by loading a tiny invisible pixel, and in 2026 that pixel is broken in ways that inflate and deflate the number at the same time. Apple Mail Privacy Protection pre-loads images, which registers opens that never happened. Plenty of corporate inboxes and Outlook configurations block the pixel entirely, which hides opens that did happen. The result is a metric that can read 60 percent or 15 percent for the same campaign depending on the recipient mix, and neither figure is real.
So what is a good open rate benchmark for cold email in 2026? A useful floor rather than a target: if open tracking shows under 20 percent, something upstream is broken, usually deliverability or a subject line that reads as spam. Above that, stop optimizing for the open number itself. A rising open rate with a flat reply rate means nothing, and chasing opens is how people end up with clickbait subject lines that get the open and then bury the offer. Track opens as a directional health check on deliverability, and judge the campaign on replies. If you want opens to trend up honestly, dynamic subject lines rotated per lead beat one static line sent to everyone, because static subjects at scale get fingerprinted by filters.
Cold email reply rate and positive reply rate benchmarks
Reply rate is the honest version of open rate. It cannot be faked by a pre-loaded pixel, and it maps directly to whether your message landed and mattered. The average cold email reply rate across all replies sits around 1 to 5 percent, a strong campaign clears 8 percent, and anything under 1 percent means the offer, the targeting, or the copy is off. But total reply rate includes the unsubscribes and the not-interested replies, so the number that actually predicts pipeline is positive reply rate: replies from people who want to keep talking.
Positive reply rate benchmarks are tighter. One to 3 percent is normal, 8 percent is strong, and on a very well-targeted niche campaign it can run to 10 or even 20 percent. For a real anchor: Primal, a Reachly client, averaged an 8 percent positive reply rate and turned that into 85+ SQLs in six months and a 4.57x ROI. The lever that moved it was not a subject line trick. It was a direct, question-based email built around an offer strong enough to be worth answering. We have watched a Series A client sending 20 to 30 thousand emails a month climb from a 0.5 to 1 percent reply rate up to 1.6 percent on the same list, purely by rewriting the offer and the copy.
The single biggest driver of both numbers is how tightly you target. The tighter the trigger, the higher the reply. This is why we run everything signal-based rather than by broad firmographics, an approach we break down in our guide to signal-based outbound. The table below shows how much targeting alone moves the benchmark.
| Targeting approach | Reply rate | Positive reply rate | What is happening |
|---|---|---|---|
| Broad, unsegmented blast | Under 1% | Near 0% | Volume with no relevance. The worst ROI in outbound and the fastest way to burn a domain. |
| Segmented by firmographics | 2 to 4% | 1 to 3% | Right industry and size, but the message is still generic. Average by definition. |
| Signal-based (funding, hiring, intent) | 5 to 10% and up | 8% and up | The message references a real, recent trigger. The Reachly standard and where Primal hit 8%. |
The LinkedIn equivalents are in Reachly's LinkedIn outreach.
Reply-rate ceilings also move by market. In Singapore, where an addressable list for a mid-market B2B seller often runs to only 500 to 3,000 accounts, list size caps the number before copy ever does. A companion guide to the Singapore cold email benchmarks and PDPA constraints covers what changes in a market that small.
Cold email bounce rate and deliverability benchmarks
Bounce rate and deliverability are the benchmarks nobody brags about and everybody should watch first, because they gate every other number. Bounce rate is the share of emails that never reached a mailbox. Keep it under 3 percent. Between 3 and 5 percent is a warning that your list is aging or was never verified, and above 5 percent inbox providers start treating the sender as careless, which drags placement down for the messages that do land. Deliverability, or inbox placement, is the share of delivered mail that reaches the primary inbox rather than spam. The 2026 target is 97 percent and above.
The fixes for both are unglamorous and non-negotiable. Validate any list older than 3 months before you send, because that is roughly how fast B2B contact data decays, and run new addresses through a verifier like ZeroBounce first. Authenticate every domain with SPF, DKIM, and DMARC plus a custom tracking domain. Warm up every mailbox for 30 days, since Google now shows a yellow warning banner on mail from domains younger than that. Keep volume conservative at 15 sends per mailbox per day on Google and 10 to 12 on Outlook, and match sender ESP to recipient ESP. Miss these and you will post a poor bounce and placement number no matter how good the writing is.
Meetings booked and cost per meeting benchmarks
At the bottom of the funnel is the only benchmark that pays rent: meetings booked. Expressed as a share of emails sent it looks tiny, and that is normal. A poor campaign books under 0.5 percent of the contacts it emails, an average one lands between 0.5 and 1 percent, and a strong one clears 2 percent. Those percentages sound small until you run the volume: at a 2 percent meeting rate, a list of 1,000 well-targeted contacts is 20 booked meetings, and in B2B that is a full pipeline for a quarter.
The more useful lens for founders is cost per meeting, because it lets you compare outbound against paid ads and against hiring. Cost per meeting is your total outbound spend, tools, infrastructure, and labor, divided by meetings booked. When you run the math, signal-based outbound almost always beats a fully loaded SDR on cost per meeting, which is the case we make in our outbound lead generation guide. You can model your own number on the ROI calculator before committing budget either way.
Reply speed moves this number, which is why Reachly offers sales inbox management as a service.
What moves your numbers above the benchmark
Hitting the strong column is not about one clever tactic. It is about getting five things right in order, because a weakness early in the chain caps everything after it. This is the exact diagnostic order we run when a campaign underperforms its benchmark.

The diagnostic order for a below-benchmark campaign
Notice the order. Founders reach for step four, the copy, first, because it is the most visible. In practice a below-benchmark campaign is far more often broken at step one or step three. Work the chain in sequence and the metrics climb in the same order: bounce and placement settle, then reply rate lifts, then meetings follow. The full version of this system lives in our modern outbound sales strategy playbook.
The benchmark that actually matters
Chasing a published average is a trap. The point of a benchmark is not to match the industry, it is to tell you which part of your campaign to fix next, and then to beat the average on the metric that ties to revenue.
People obsess over open rate because it is the biggest number on the dashboard, and in 2026 it is also the fakest one. The goal of a cold email is a reply, not a meeting and definitely not an open. If your positive reply rate is below benchmark, the problem is almost never the subject line. It is the offer or the targeting. We do not diagnose a campaign by its open rate. We look at bounce, then placement, then positive replies, and fix in that order. That is how Primal ran an 8 percent positive reply rate and a 4.57x ROI while everyone else was celebrating a 45 percent open on emails nobody answered.
Further reading
Reachly publishes these figures from live client accounts and updates them as the numbers move. The current ranges for all seven, including cost per interested lead and time to first meetings, are on LinkedIn.
Read the 7 cold email benchmarks we actually track →Get your cold email numbers above benchmark
Every benchmark in this guide is reachable, and plenty of teams reach them on their own. What takes the time is the boring layer underneath: the domains, the mailboxes, the authentication, the 30 day warm up across a fleet of inboxes, and the signal engine that keeps the targeting tight enough to clear an 8 percent positive reply rate. That is the part most in-house teams underestimate.
Reachly runs the whole stack as a done-for-you service across cold email, LinkedIn, and cold calling: infrastructure, signal-based targeting, offer and copy, and the campaigns on top. Client campaigns hold bounce rate under 2 percent, and for Primal that setup produced an 8 percent average positive reply rate, 85+ SQLs, and a 4.57x ROI. If you would rather beat the benchmark than build the machine that beats it, our cold email agency team handles it end to end, typically live within 2 to 3 weeks. You can see the full picture and book a call from the Reachly homepage.
Cold email benchmarks FAQ
Average sits at 1 to 5 percent for all replies, and 8 percent and above is strong. The number that matters more is positive reply rate, replies from people who want to keep talking, where 1 to 3 percent is normal and 8 percent is strong. Tight, signal-based targeting is what moves you into the strong range.
Open tracking relies on an invisible pixel. Apple Mail Privacy Protection pre-loads it and registers opens that never happened, while many Outlook and corporate inboxes block it and hide real opens. The same campaign can read 60 percent or 15 percent depending on the recipient mix, so use opens only as a rough deliverability check, not a success metric.
Under 3 percent. Between 3 and 5 percent signals an aging or unverified list, and above 5 percent inbox providers start penalizing the sender, which hurts placement for the mail that does deliver. Validate any list older than 3 months before sending, since B2B contact data decays fast.
2 percent of contacts emailed and above is strong, 0.5 to 1 percent is average, and under 0.5 percent is poor. It sounds small, but at 2 percent a list of 1,000 well-targeted contacts books 20 meetings, which is a quarter of pipeline in most B2B motions. Cost per meeting is the more useful way to compare outbound against ads or hiring.
Work in order: fix infrastructure (authentication, 30 day warm up, conservative volume), tighten targeting to real signals, sharpen the offer, shorten copy to 70 to 80 words, and cut the sequence to two emails then re-engage later. A below-benchmark campaign is usually broken at infrastructure or offer, not copy, so diagnosing in that order is what lifts the numbers.