Learn tam sam and som for B2B outbound with a worked example that turns market sizing into named accounts, buyers, and pipeline.
TAM, SAM, and SOM for B2B outbound are only useful when they turn into named accounts, named buyers, and a list your team can work in the next 6 to 12 months. If your tam sam som exercise ends as a slide with a big dollar figure, it will not help you book the meeting.
If you want the short definition of TAM first, read Reachly’s guide to total addressable market. This piece is about the next step: working out all three numbers for outbound, then turning them into a real list.
What do tam sam som mean in B2B outbound?
Outbound, TAM is every ICP-fit account you could sell to. SAM is the slice you can actually serve with your current product, team, geography, and go-to-market setup. SOM is the part of that reachable market you can realistically win with your current capacity.
Keep TAM short. The University of Waterloo’s 2026 explainer defines it as total market demand, with SAM as the reachable segment and SOM as the realistically attainable share. That works for finance and strategy. For outbound, you need one extra rule.
Count accounts first, then convert to revenue.
[markdown] | Market layer | What it means for outbound | Simple way to calculate it | | --- | --- | --- | | TAM | Every company that fits your ICP | ICP-fit accounts × average annual contract value | | SAM | The companies you can serve now | TAM filtered by geography, product fit, language, sales coverage, and compliance | | SOM | The companies you can realistically win from SAM | SAM filtered by current team capacity, channel reach, and expected win rate | [/markdown]That account-first view matters because outbound is account selection before it is copy.
Why does bottom-up tam sam som work better for outbound lists?
Top-down market sizing is fine when you need a board slide or investor narrative. It is weak when you need a list for cold email, LinkedIn, and cold calling.
Salesforce’s 2026 guidance says both top-down and bottom-up methods are valid, but bottom-up starts with real sales data and customer-level math. That is the method that fits outbound, because you are not trying to impress anyone with a large category number. You are trying to decide which 200, 2,000, or 20,000 accounts deserve attention.
You cannot send a sequence to a percentage point.
A top-down TAM usually starts with analyst reports, broad industry counts, and a lot of assumptions. A bottom-up TAM starts with real filters, real account counts, and the geographies you can actually work this quarter.
After that distinction, the choice gets simple:
- Top-down sizing: good for category size, investor decks, and rough planning.
- Bottom-up sizing: good for account lists, outbound capacity planning, and revenue math you can defend.
Reachly uses bottom-up market sizing at the start of every engagement because outbound needs a workable market, not a flattering one.
How do you calculate tam sam som for a real outbound campaign?
Start with your ICP, not your category. “B2B SaaS” is a category. “Series A and B fintech SaaS companies with 50 to 500 employees, English-speaking buyers, and a current compliance team” is closer to an ICP.
Then build the market from the company level up. Reachly maps TAM from 10+ data sources, not one database, because no single source gives you full market coverage with clean enough data to trust. That usually means combining Clay, AI Ark, Apollo, LinkedIn Sales Navigator, RB2B, Trigify, and verification tools like ZeroBounce and MillionVerifier.
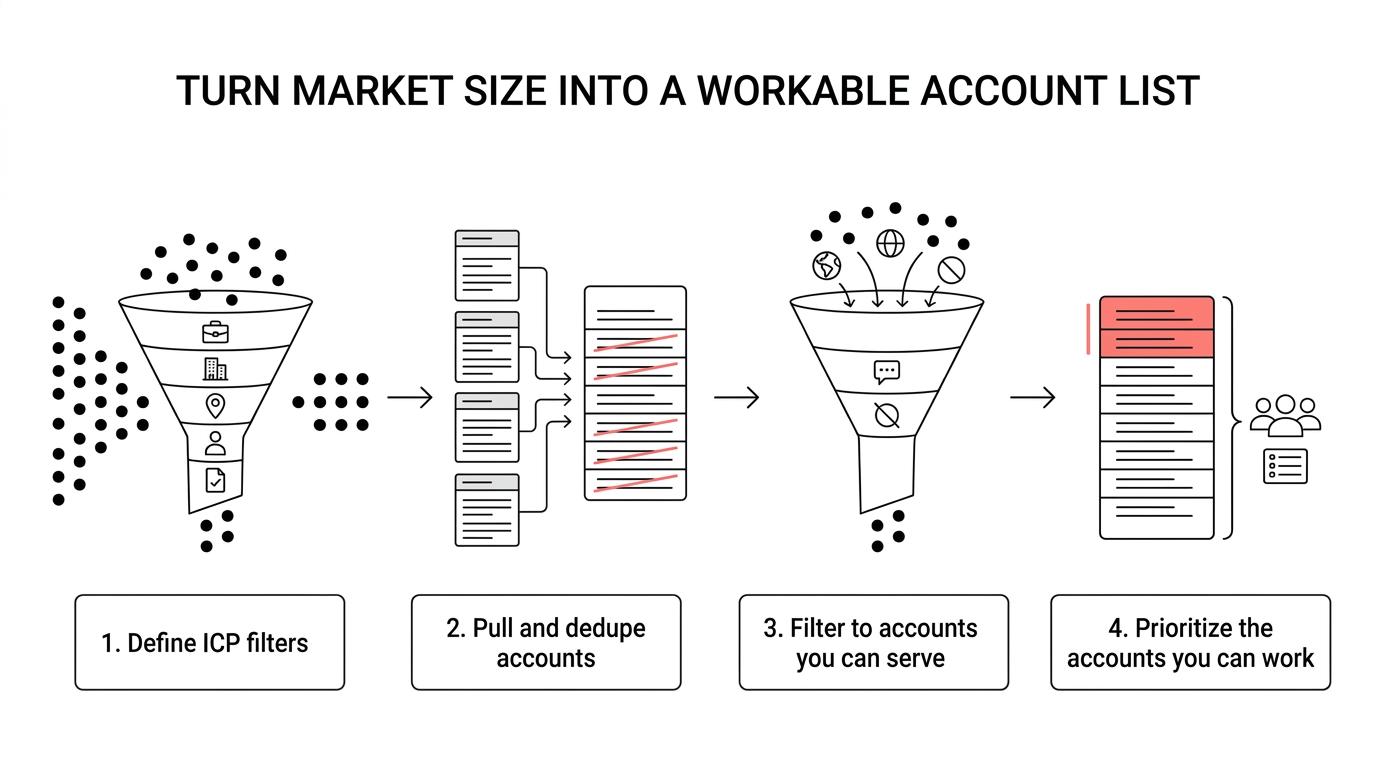
Here is the working order.
[markdown] | Step | What you do | What gets removed | | --- | --- | --- | | 1 | Define ICP filters by industry, employee band, geography, buyer title, and ACV fit | Broad category noise | | 2 | Pull companies from multiple sources and dedupe them | Duplicates and missing accounts | | 3 | Filter to current serviceability | Countries you do not serve, non-supported use cases, language mismatch | | 4 | Filter to attainability | Low-fit accounts, weak buying signals, unreachable buyers, accounts beyond current capacity | [/markdown]Thibault Garcia, founder of Reachly, puts it plainly: “Your list is part of your copy. Before anything goes live I want to know that ninety percent or more of the people receiving this email are genuinely right for this specific offer. If they are not, the copy was never the problem.”
That last step is where most teams get SOM wrong. They treat SOM as a market share guess. In outbound, SOM is closer to a worked target account pool. It should reflect list quality, channel capacity, and how many accounts your team can touch well without wrecking deliverability or focus.
If your list is older than 3 months, re-validate it before send. If your bounce rate is above 3%, your market sizing math does not matter much because the infrastructure problem will drown it out.
What does a worked tam sam som example look like?
Say you sell a compliance SaaS product to fintech firms. Your average annual contract value is $18,000. You want to run outbound in the US, Canada, UK, and ANZ.
You define your ICP as fintech companies with 50 to 500 employees, a named compliance leader, and a product team large enough to feel the pain you solve. After pulling and deduping companies from multiple sources, you find 3,200 ICP-fit accounts across those four markets.
That gives you a raw TAM of $57.6M.
Next, you cut the list down to accounts you can serve right now. You remove firms in segments your product does not support yet, accounts without English-speaking buyers, and countries where your team cannot sell or support well. That leaves 1,400 accounts, or a $25.2M SAM.
Then you get honest about capacity. You have enough sending infrastructure, SDR time, and sales coverage to actively work 320 high-priority accounts over the next two quarters. Based on current performance, you expect to close about 2.5% of those worked accounts. That gives you a SOM of 8 customers, or $144,000 in near-term obtainable revenue.
[markdown] | Layer | Account count | Revenue view | Why it changed | | --- | ---: | ---: | --- | | TAM | 3,200 | $57.6M | All ICP-fit fintech accounts in target regions | | SAM | 1,400 | $25.2M | Removed unsupported segments and unreachable geographies | | SOM | 320 worked accounts | 8 customers = $144,000 | Limited by current outbound capacity and expected win rate | [/markdown]This is a worked example, not a market claim. Your numbers will move based on ACV, win rate, buying committee size, and how narrow your ICP is.
The point is the shape of the exercise. TAM tells you whether the market is worth chasing. SAM tells you where you can sell now. SOM tells you what to work next.
How does Reachly turn tam sam som into an outbound list?
This is where most articles stop and where the actual work starts.
Reachly does not treat TAM mapping as a spreadsheet exercise for its own sake. The output is a live account list ranked by fit and buying signals, ready for signal-based outbound through cold email, LinkedIn, and cold calling.
The source mix matters because different tools catch different parts of the market.
[markdown] | Source type | What it adds to TAM mapping | Tools Reachly uses | | --- | --- | --- | | Company and firmographic data | Broad account coverage, employee bands, industry filters | Clay, Apollo, AI Ark | | Buyer and account research | Title mapping, manual review, account validation | LinkedIn Sales Navigator | | Website and intent signals | Visitor ID, ranking gaps, traffic changes | RB2B | | LinkedIn activity signals | Engagement, job changes, account activity | Trigify | | Contact verification | Email validity before send | ZeroBounce, MillionVerifier | [/markdown]After the account universe is built, the list gets prioritized. Reachly scores accounts using company-level signals like hiring, headcount growth, tech stack change, leadership change, and funding, plus website and LinkedIn activity when available. Those intent signals have a shelf life of roughly 2 to 4 weeks, which is why a good TAM map is not static.
A clean TAM map also stops you from working the wrong market too early. SOM should be the first thing you own, then you expand into SAM once the offer and list quality hold up.
You can see that pattern in results. On The Great Room, tighter outbound targeting helped move face-to-face meetings from about 2 per quarter to 2 per month and contributed to $250K in closed contract value. On Primal, the campaign produced 85+ SQLs in 6 months and 4.57x ROI. Those outcomes came after list quality and market focus were handled first.
When does tam sam som break for outbound?
It breaks when the math ignores the way outbound actually gets done.
If your ACV is under $5,000, you need to be careful. The room for error gets very small, and a heavy outbound setup may not make sense yet. If your market is tiny, founder-led outreach to a short dream list is often the better move.
It also breaks when SAM is built on product ambition instead of current reality. If you say you serve North America and Europe but your team only sells well in two markets, your SAM is inflated.
The other common failure is turning SOM into wishful thinking. If you can only work 250 accounts well this quarter, a 5,000-account SOM is fiction.
Watch for these two signs:
- weak replies from accounts that looked good on paper
- list coverage gaps across your supposed core market
Both usually mean your ICP filters are too broad, your source mix is thin, or your serviceability rules are not strict enough.
What should you do with your tam sam som this week?
First, recalculate all three in account counts before you touch revenue. You want to know how many companies fit, how many you can serve now, and how many you can actually work with your current team and infrastructure.
Second, pressure-test your SAM filters. Geography, language, buyer accessibility, product fit, and sales coverage should all cut accounts out. If they do not, your SAM is probably still just TAM with better formatting.
If you want help turning tam sam som into a live outbound system, Reachly maps TAM from 10+ data sources, scores accounts with real buying signals, and runs the campaign through outbound lead generation services. You can start there, review the process, and book the meeting when you are ready.
The short version is simple. TAM, SAM, and SOM matter in outbound only when they become a named market you can prioritize, contact, and close.
- Count accounts first: if you cannot name the companies in your market, your sizing is not ready for outbound.
- Let SOM reflect capacity: base it on the accounts you can realistically work and win in the next 6 to 12 months, not on the market size you wish you had.